


By Tetiana Stoyko
- CTO & Co-Founder
Key Features for Dashboard Application for Admin
What is the admin dashboard feature, how does it look like, how does it differ from reports, and what are its most essential features
Nowadays, we live in a world, driven by countless data streams.
Statistics and business intelligence always played an essential role in any type of management, regardless of your operational approach. Having all the actual information about the vital business processes helps not only to estimate the performance of your business or other key metrics but also to know what is wrong or can and should be improved for better results.
Analytical dashboards and graphs have probably existed long before we started to identify and understand their true potential and role as information management tools like pie charts.
Yet, while previously most of such solutions were made manually, today we have an opportunity to automate operational dashboard software creation thanks to the evolution of the software development industry. For instance, interactive dashboard apps, based on the web or already integrated into your software product are already a common phenomenon.
Still, the dashboard tool is much more complex and diverse, than it may seem initially. Therefore, before starting to design or adopt business dashboard SaaS solutions, it is recommended to learn more about such technology, what types of dashboards exist, which is the most suited for you, and how to develop one.
Custom Dashboard Feature in a Nutshell
To make it simple, a dashboard in modern connotation is a form of information management, that helps to create a visual representation of key business metrics or data in one place, analytical tools, and a user-friendly interface.
As was said before, effective dashboards are by far not a new phenomenon. Nevertheless, modern IT technologies are pushing their potential to new levels, starting with new UI design patterns and ending with complex code-based components, interactive features, and customization options like choosing the type of chart to display valuable insights or drag-and-drop interface.
 Click to expand
One of the most recent trends in this field is the increased collaboration capability. With the use of open-source API integrations, it became possible to simplify the process of data update and make it reachable in a few clicks, instead of manual entry of data by business users.
This applies not only to internal data gathering and sharing but can commonly be used to get different types of data from third-party applications like Google Drive, Ahrefs, etc.
Frankly speaking, the situation with modern dashboard app cooperation is similar to Notion-like applications: the more third-party services can be integrated - the better.
The main target audience of dashboards - is administrators or other management experts, who have to deal with the statistics and monitor the relevant information on different business-related processes, being able to notice and analyze them for adjusting business strategies.
In other words, well-designed dashboards are similar to admin panels and are mainly reachable in the admin mode, or with the use of access via credentials or other means of authorization.
The Difference Between Dashboards and Reports
 Click to expand
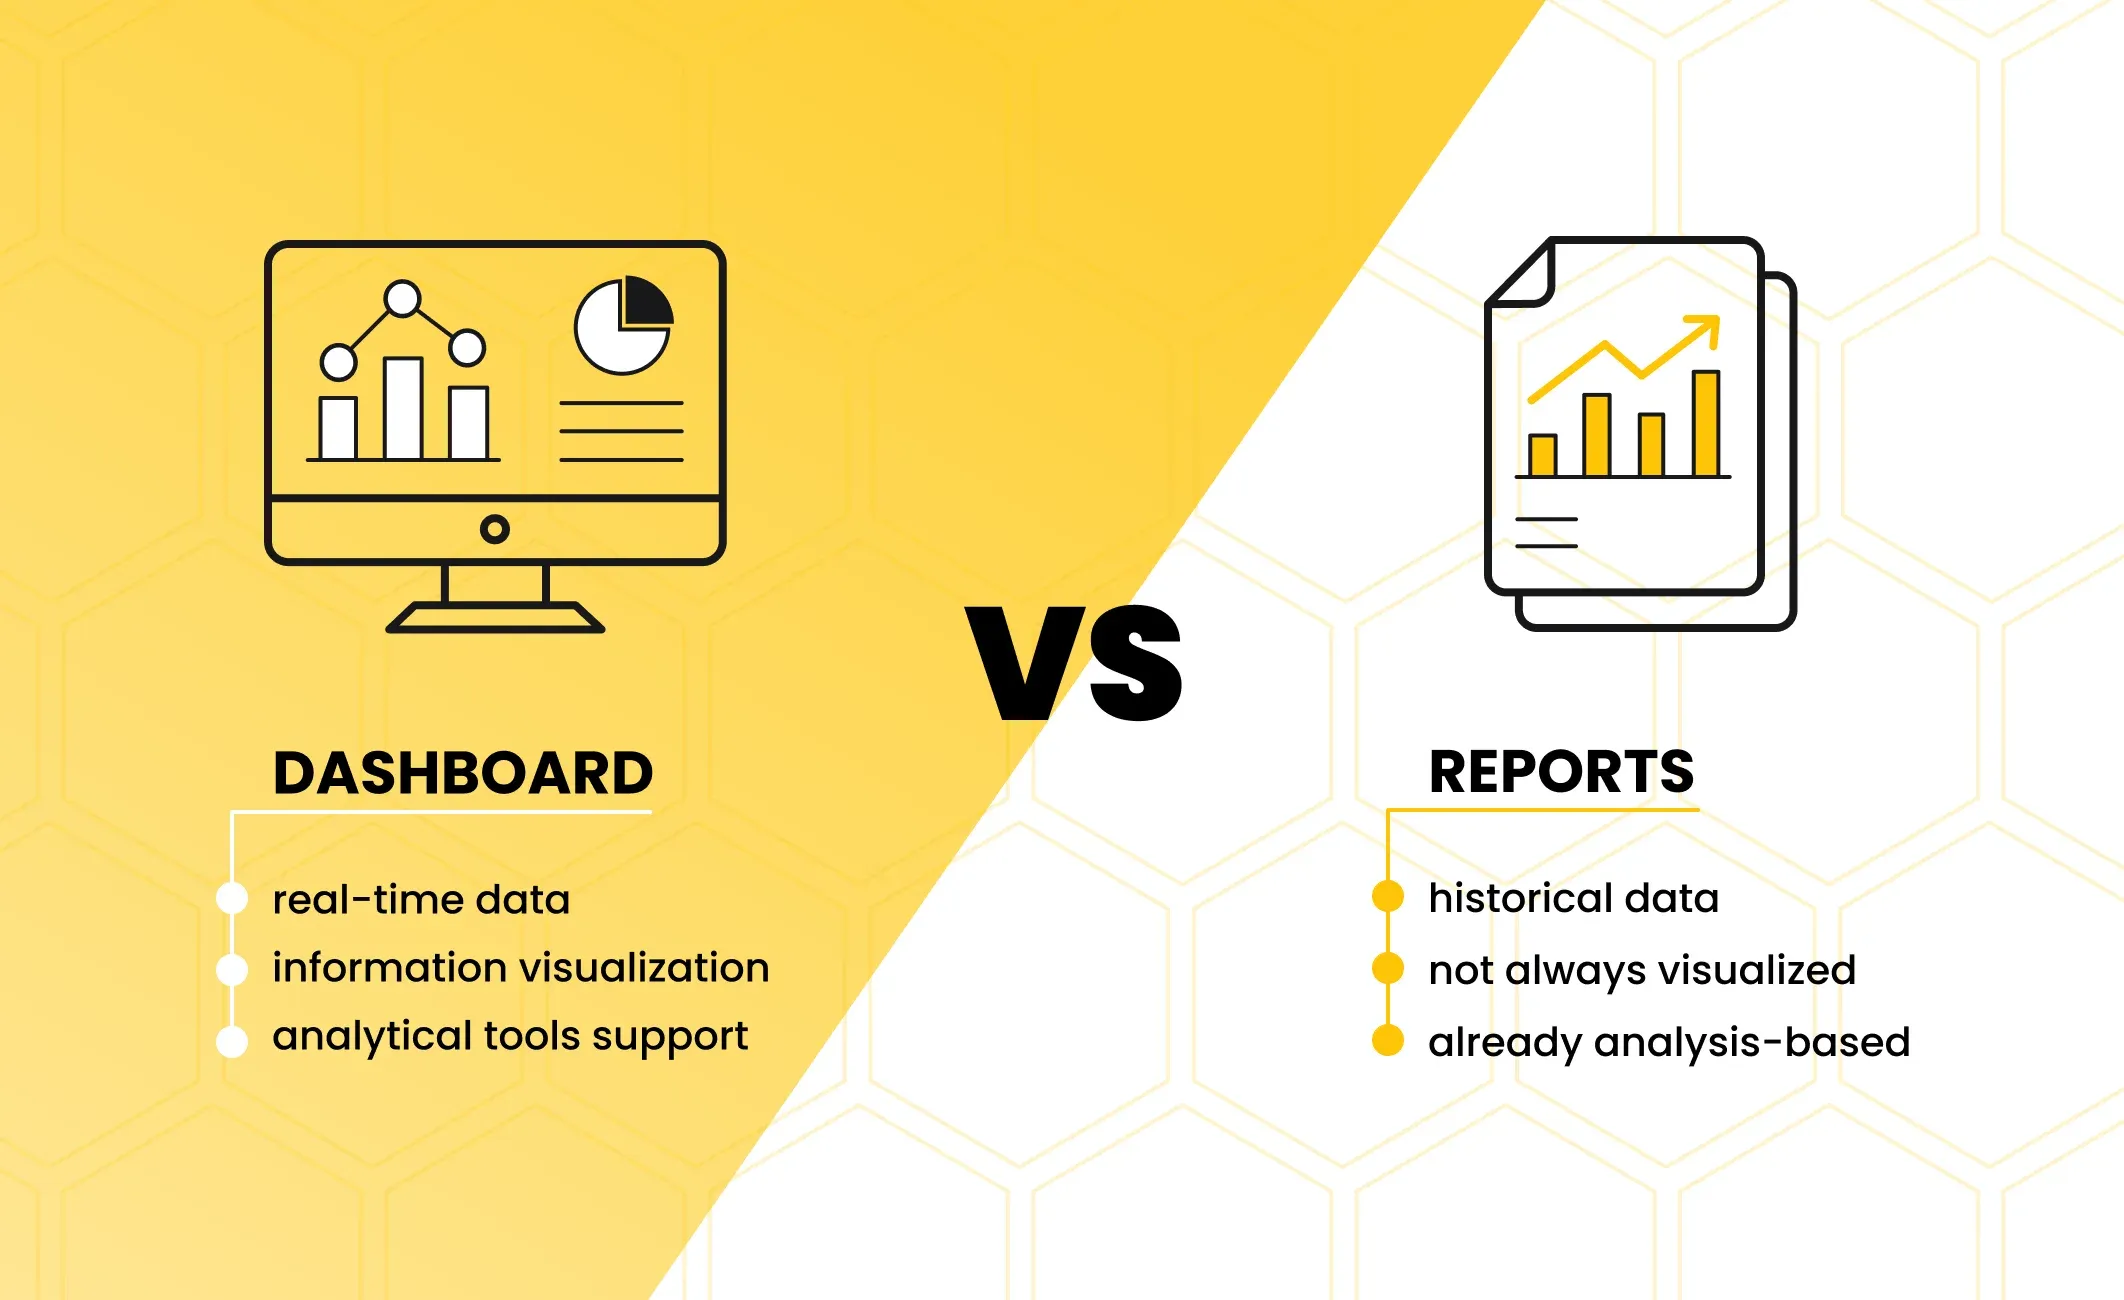
As for now, it may seem, that the main difference between reports and dashboards is how they may look: reports mainly exist in a text format, while dashboards aim to visualize the data.
However, it is a mistake. The significant difference between these information management methods is their actuality. Dashboards operate real-time data, showing the most recent updates, while reports consist of already operated data, for instance, displaying information for the previous month, days, or hours. To make it simple:
- Dashboards - recent data
- Reports - historical data
So, they are incapable of replacing each other. Instead, it is best to find a way to combine both methods to achieve better and more functional results.
Essential Dashboard Features
So, what are the core app dashboard features?
Frankly, one of the main advantages of using software-based dashboards - is the possibility to customize them according to your needs and requirements. So, it is possible to say, that the final list will vary, depending on your personal preferences.
However, we can define the list of the most important functional options and specifics instead.
 Click to expand
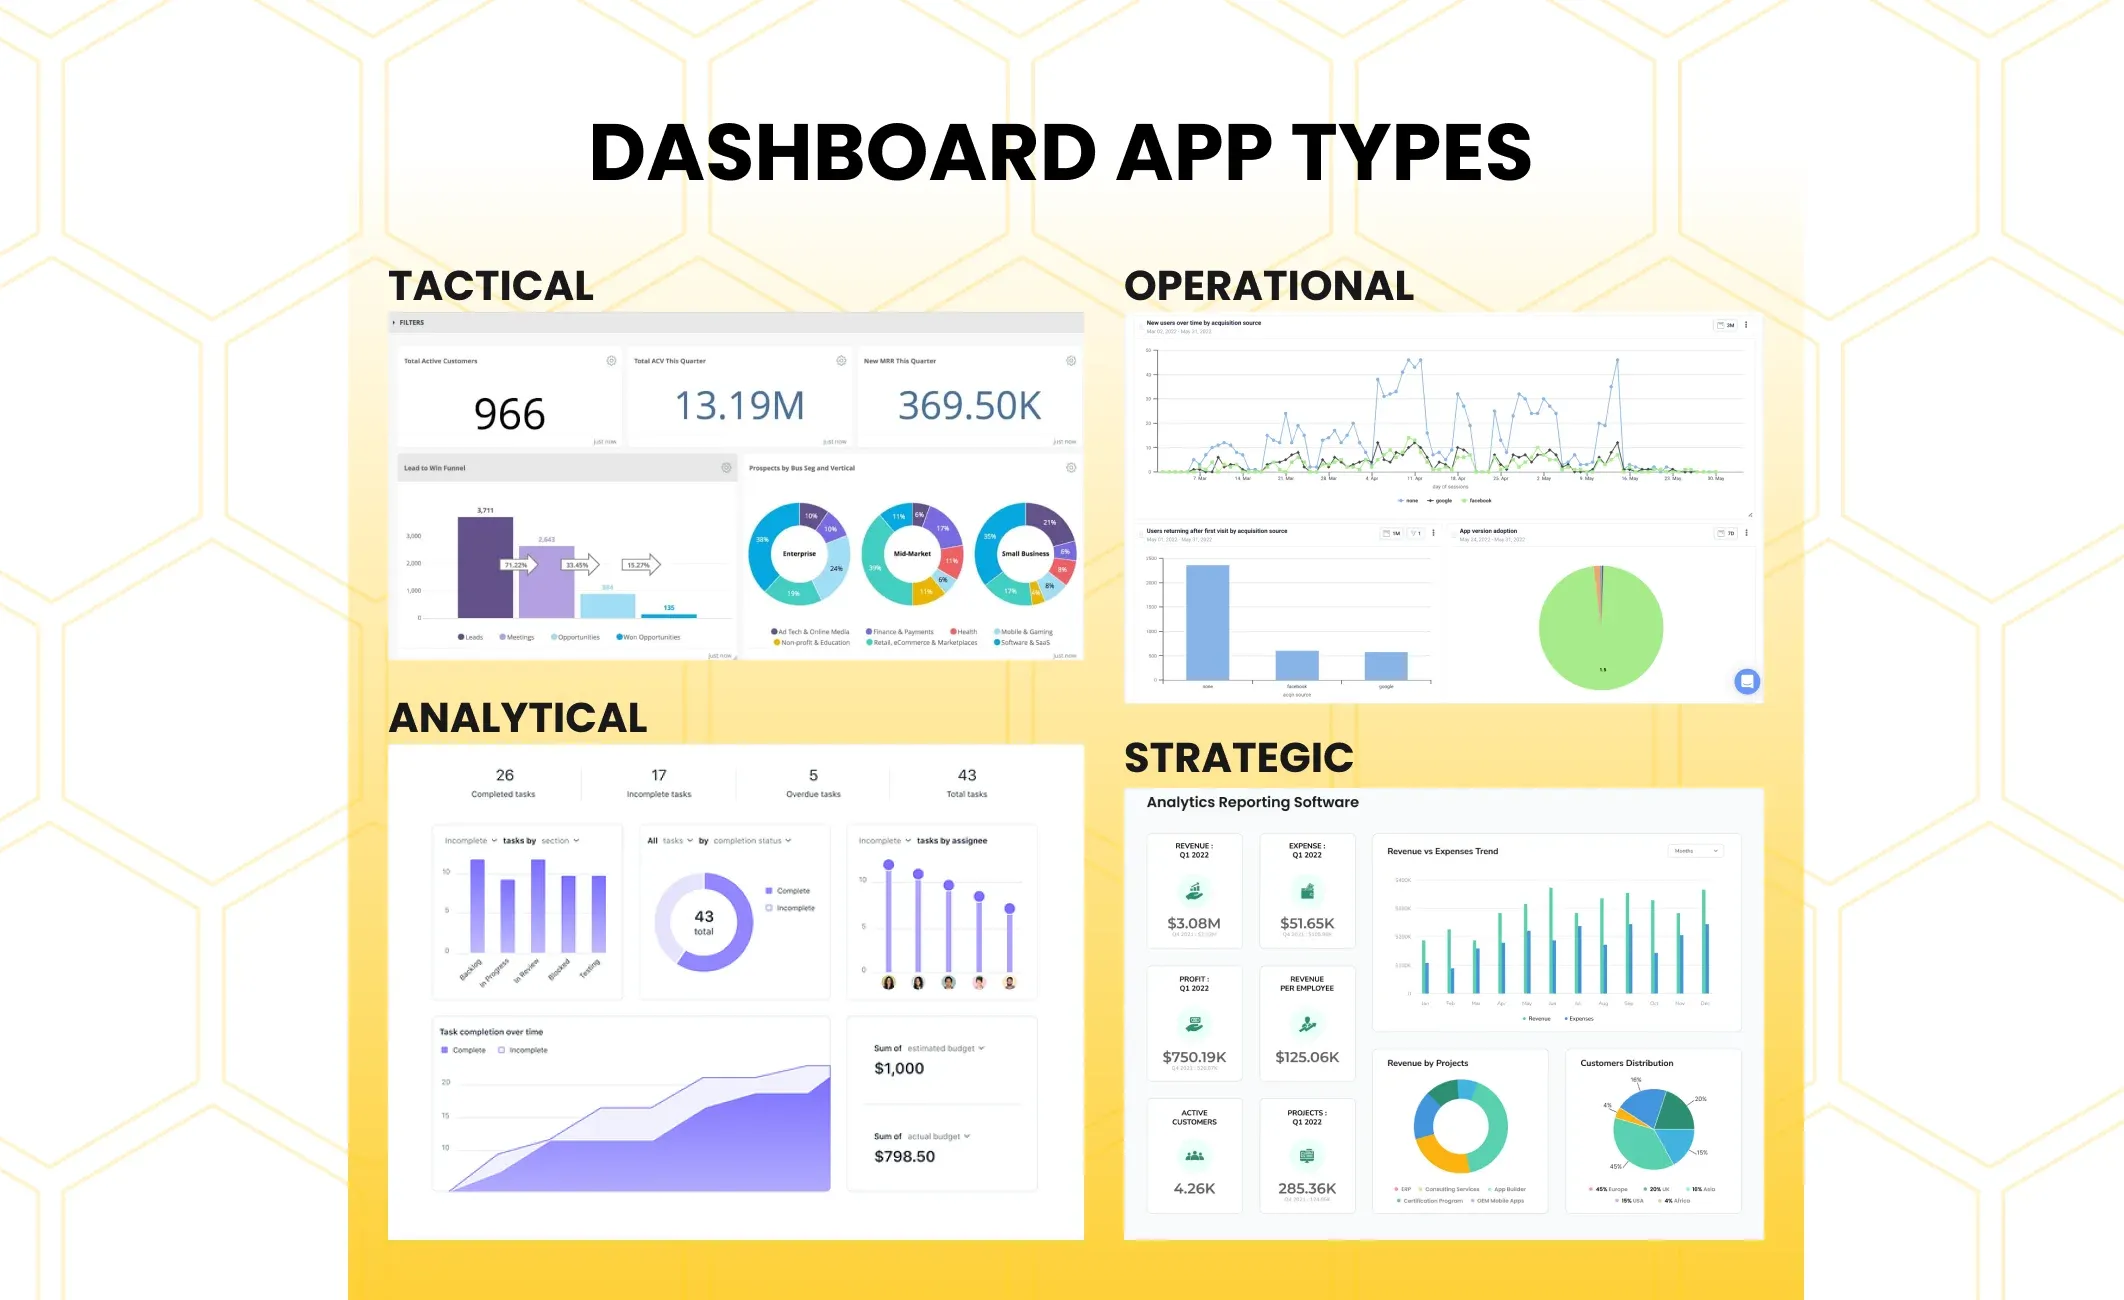
First of all, we have to mention, that there are at least 4 different types of admin dashboards:
- Strategic (an information management tool, used for long-term data tracking and performance monitoring, and their correlation with the company strategy)
- Operational (a common type of business intelligence dashboard, used to track performance tracking in short-term projects or operations)
- Tactical (aims at mid-term activities and lies between the strategic and operational types, unlike them, is more suited for analysis instead of monitoring)
- Analytical (used to better visualize complex data in a user-friendly way to simplify the data analysis process)
Even if the admin panel dashboards vary, depending on the goals you want to achieve, and the level of the data display, most of them have the same or, at least, similar core features.
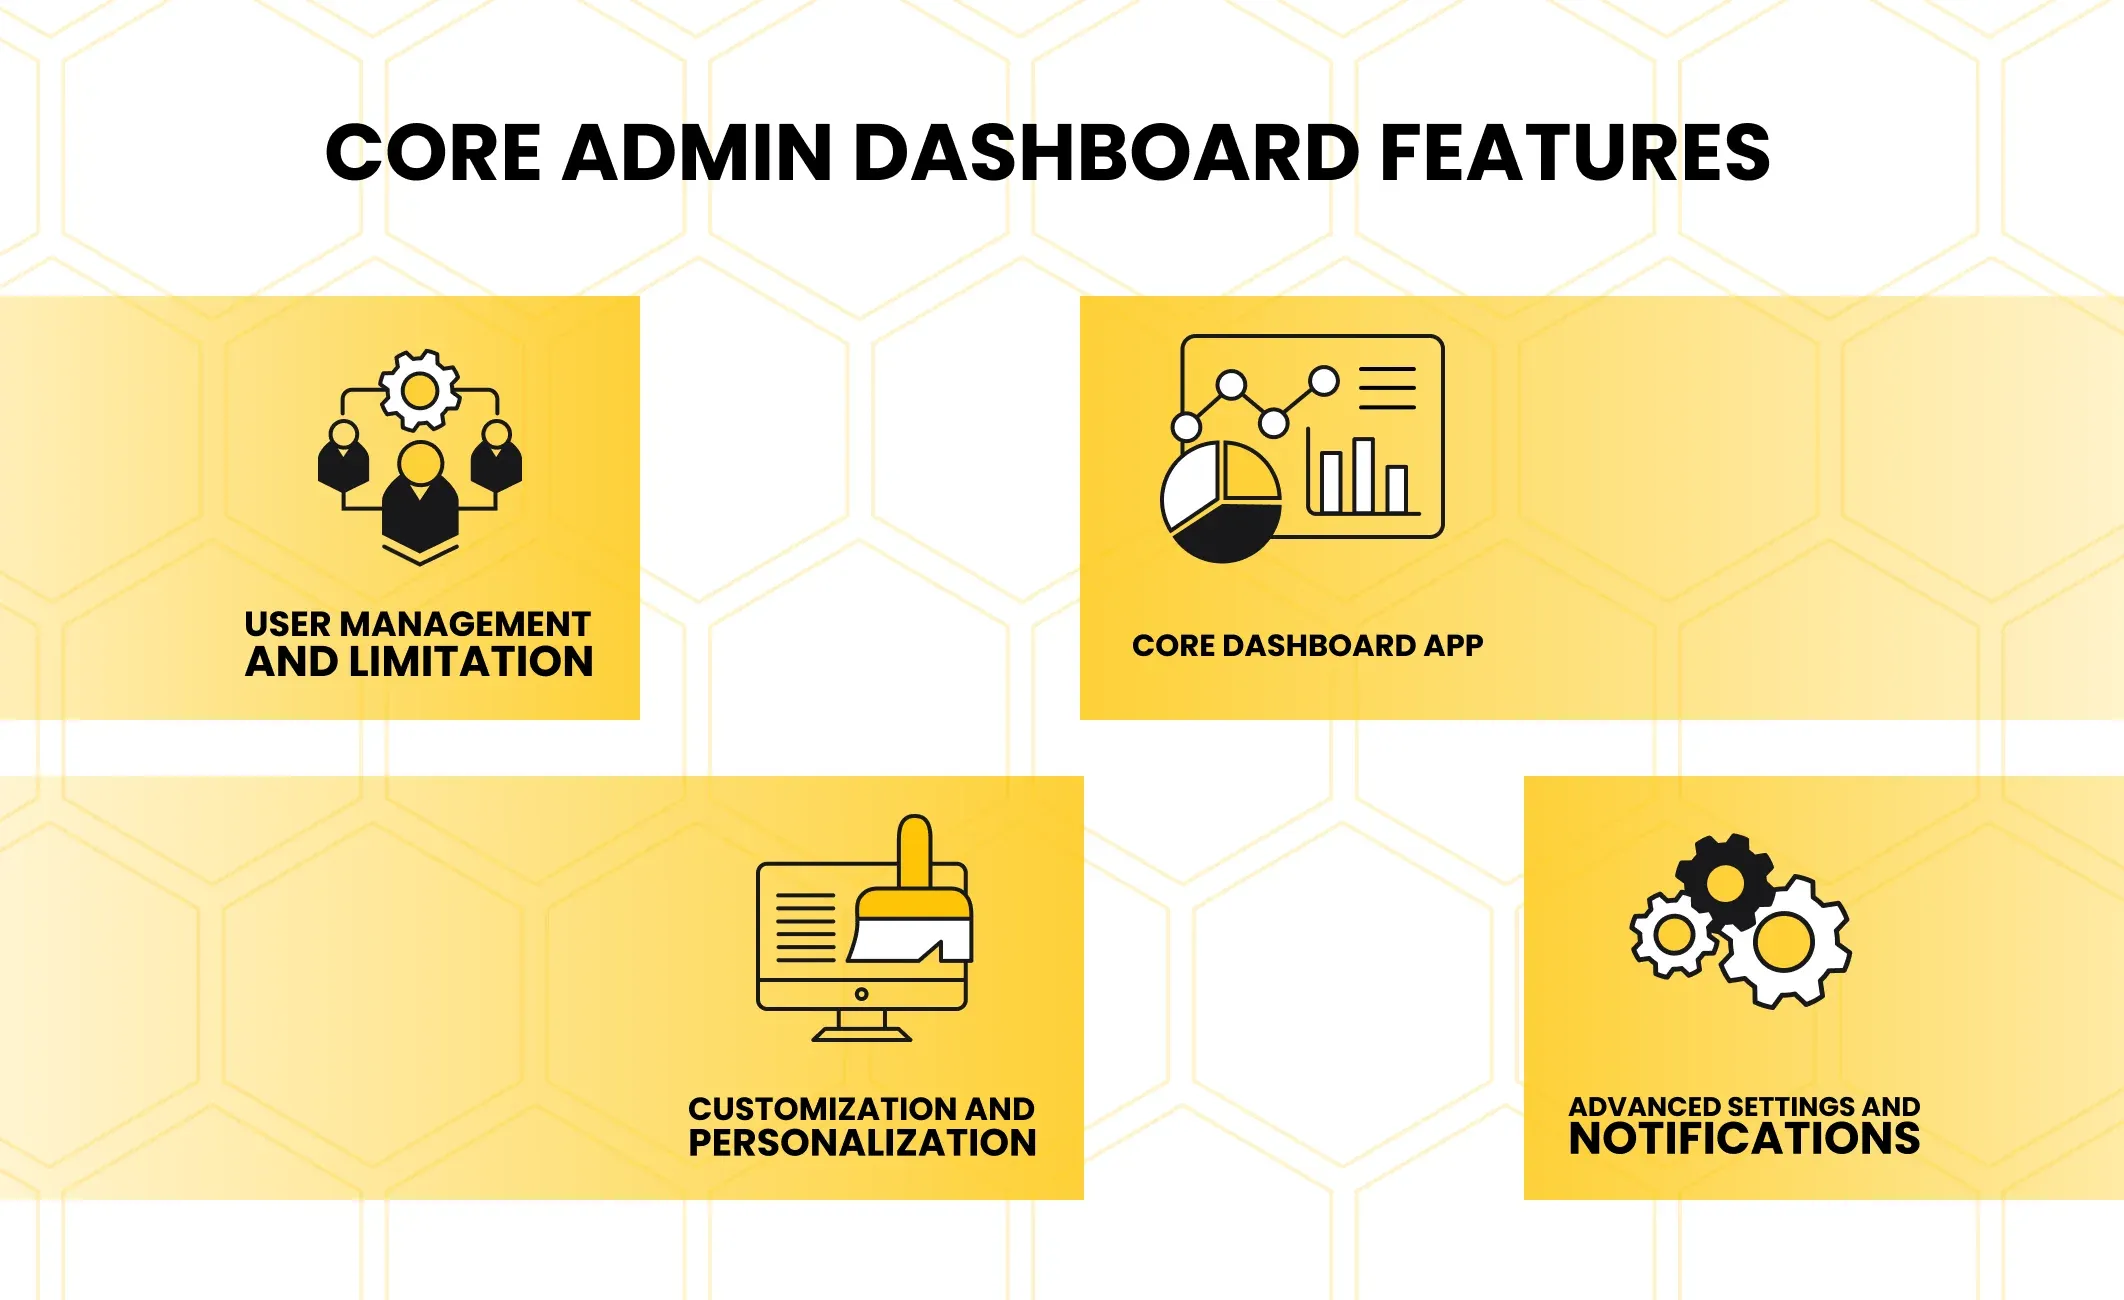
User Management and Limitations
First things first, you will need to ensure, that such vulnerable feature as the admin panel dashboard is safe from third-party interactions. One of the easiest and most effective ways to do so - is to enable authorization and limit the access to such functionality.
For instance, you can assign the role of supervisor to someone in your team, who will be responsible for giving access to the admin panel. As an extra security measure, it is recommended to enable access via specified corporate IP, which will make it harder for ill-wishers from the outside to somehow harm your system.
Core Dashboard App
You will also need to develop a code-based application for your dashboard or find a ready-made SaaS for data management and tracking.
In any case, it is vital to ensure that it will be a centralized platform, that will support data updates and inputs and displace it in one place, instead of dozens of individual tabs, etc.
Also, it is worth taking care of data tables and ways to work with them. For instance, to add such basic options like filtering, sorting, pagination, etc. As an extra solution, you can try to design the possibility to switch between dashboard types or enable adding multiple dashboards for different projects.
Templates, forms, or other predefined methods to structure data will also bring a lot of value to your interactive dashboard, giving your analysts and managers extra tools to automate and simplify repetitive manual tasks for data entry or validation, as well as other potential ways to interact with it.
Besides, don’t forget the importance of various solutions for improved analytics and reports. They can be developed from scratch by your dedicated team, or you can integrate some ready-made solutions, depending on whether they will fulfill your expectations and needs, or not.
Customization, Personalization, and Notifications
Eventually, you want your dashboard app to be efficient and show the best possible results.
While the code-based elements are predetermined and can improved with the use of extra coding or third-party products, they won’t help you to deal with the human factor of your employees.
This is why, to achieve success, give your specialists some customization and personalization options. It can be the ability to replace different graphs, relocate and sort them according to personal preferences, etc. Enabling advanced settings is an advantage as well.
One of the most underrated features of personalization is the ability to set up reminders and pop-up notifications. They are compelling in cases when the dashboard admin can customize them.
For example, give them a chance to define what metrics or status updates can be shown as a standalone notification. Thus, dashboard operators would be able to notice even small changes at the moment they appear, making it possible to pay more attention to the most crucial elements.
For a better illustration of how all the foregoing can be combined in a single dashboard application, let’s consider one of our recent case studies.
Dashboard App: Arizto Case
 Click to expand
Frankly speaking, the dashboard feature is a useful addition not only for business strategy creation and KPI tracking. As a matter of fact, it can also be a powerful tool for various industries.
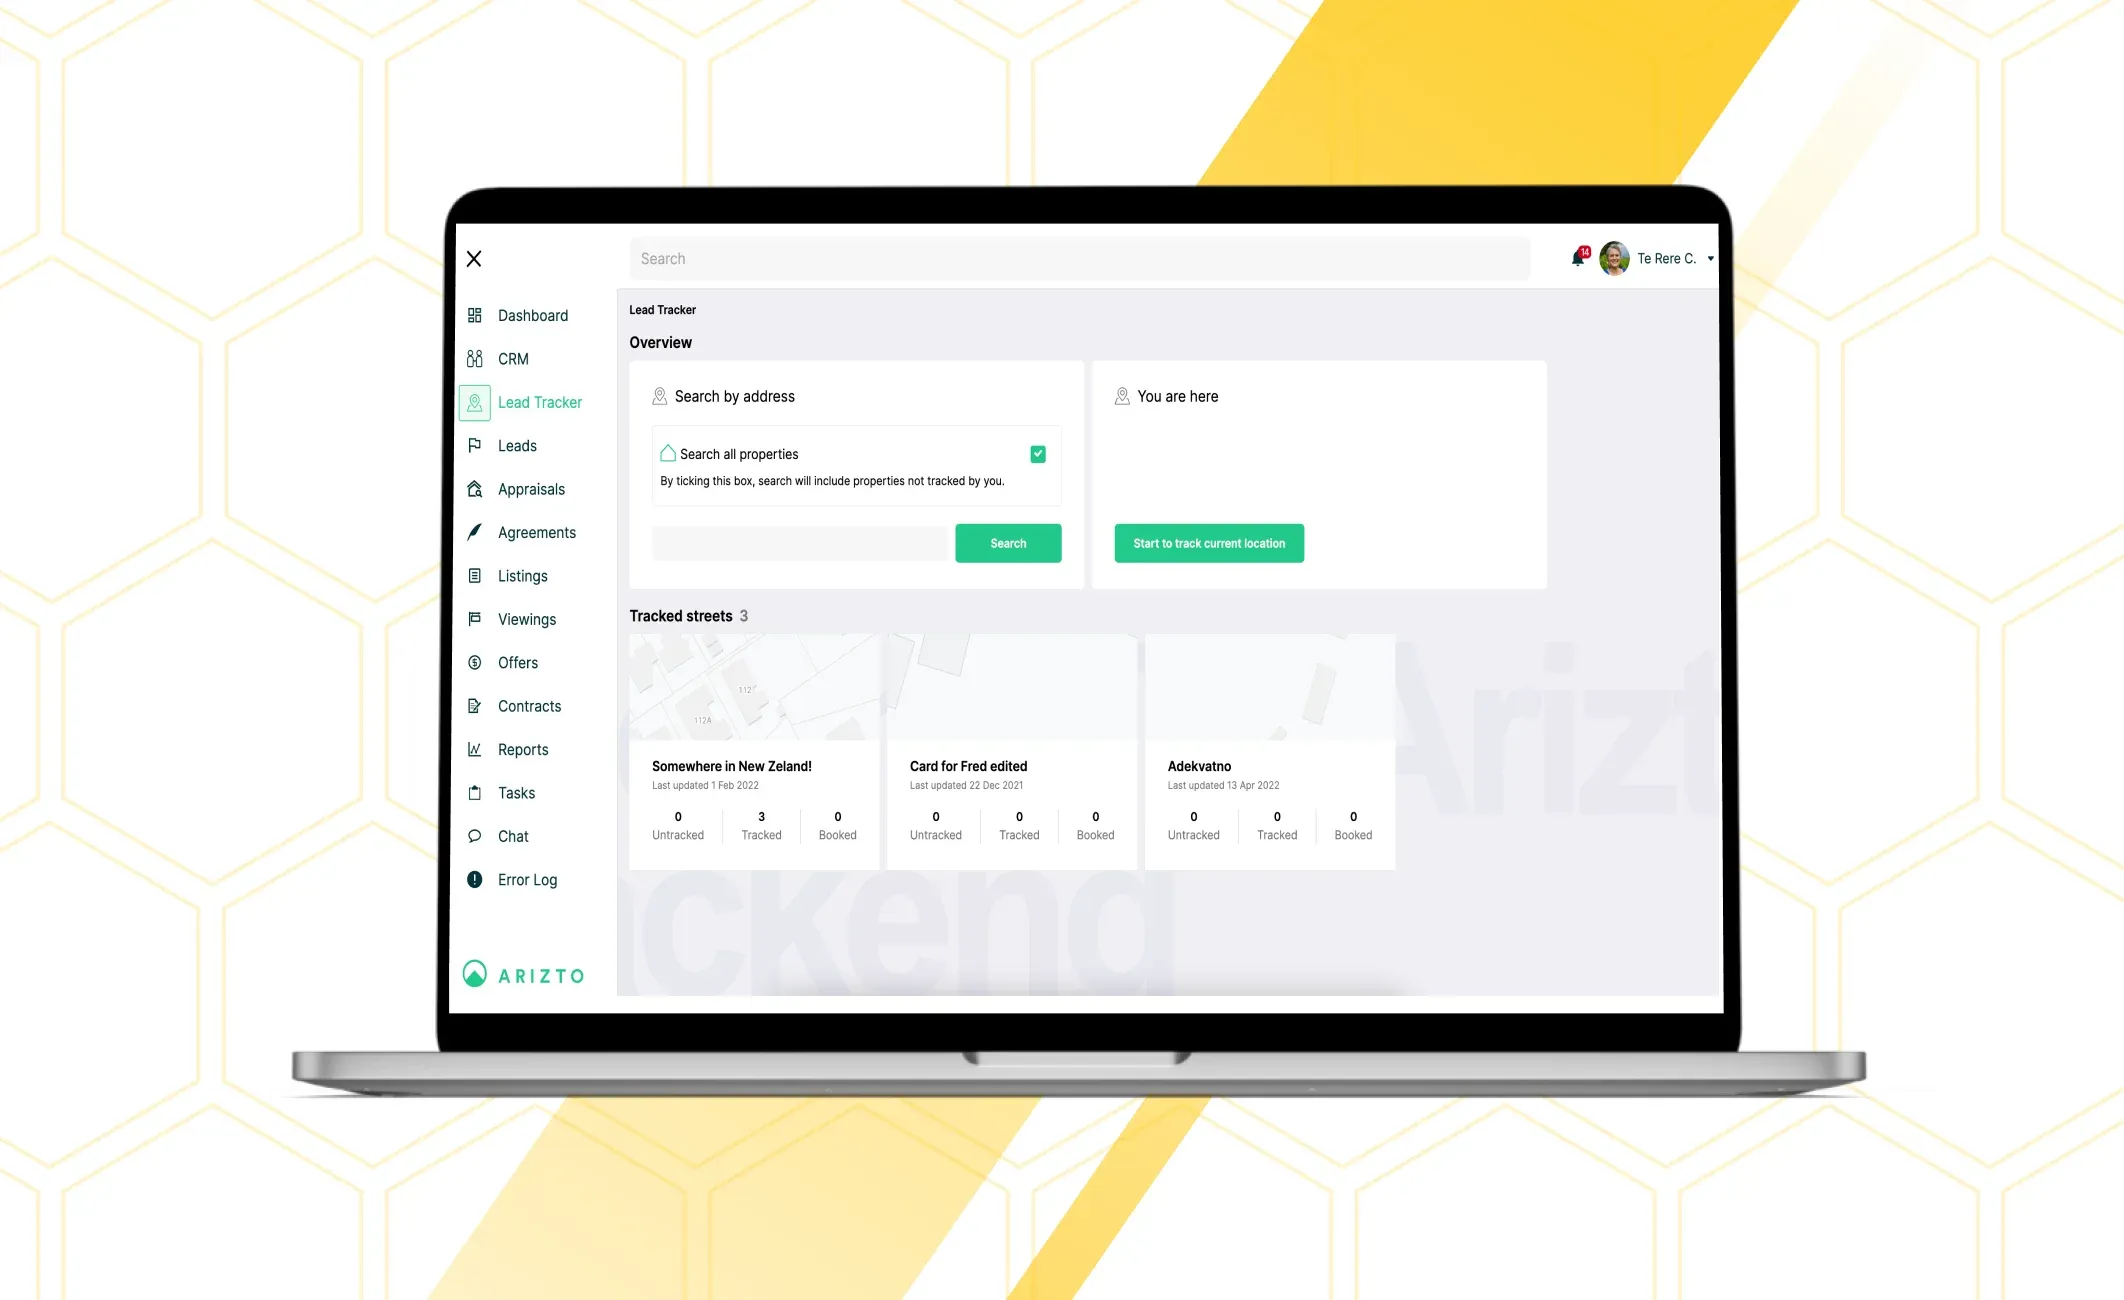
For illustration, Arizto is a platform in the real estate industry, that uses a variation of a dashboard feature to display real-time deals, as well as the status of a particular house or apartment, find other relevant information about them like photos, location, licensed agent, responsible for the property, etc.
To cut a long story short, Arizto utilizes an interactive dashboard feature to make a more user-friendly platform for buying or selling property, as well as finding all needed information about particular houses.
To do so, the Arizto development team decided to create a full-fledged eCommerce platform, which will mainly operate data, analyze and update it, and display it in a more informative and convenient way, so that users have a more intuitive and seamless experience with the application. Therefore, we can assume, that it is another type of dashboard, designed not for analytics in particular, but for a much wider group of customers, who might benefit from using these data management tools for their purposes.
Dashboard Feature Development with Incora
Despite the fact, that our developers were not involved in the Arizto case from the very beginning, we still managed to gain important experience in working with such type of software. Besides, this is not the only dashboard project, we took part in.
For more details, we encourage you to check some of our recent case studies.
Eventually, when it comes to creating such technological solutions as dashboard features, you will need the help of niche-experienced developers. One of the easiest and most productive ways is to simply hire a dedicated team, that will work with you on an outsourced basis.

For example, if you choose Incora over our competitors, you will get not only a full-fledged team of developers with proven experience but also many extra services like transparent and efficient project management, fast and responsive messaging, and reports about the progress and status of development, business consulting, and many other proposals.
In case you are interested in a productive cooperation - sign the contact form, and we will get in touch for the rest details.
FAQ
What is an Admin Dashboard?
An Admin Dashboard is a web-based interface that provides administrators with a centralized and visual representation of data and key metrics relevant to the management and performance of a system or organization.
Why is an Admin Dashboard important?
An Admin Dashboard is crucial for efficient decision-making, monitoring system health, and managing various aspects of an organization. It offers a real-time overview of key performance indicators (KPIs) and helps administrators stay informed.
What are the essential features of an Admin Dashboard?
Real-Time Data Updates, User Management, Customization Options, Visualizations and Graphs, Alerts and Notifications, Historical Data Analysis, Integration with Other Systems, Mobile Responsiveness, Security Features.
How can an Admin Dashboard enhance decision-making?
An Admin Dashboard enhances decision-making by providing administrators with a consolidated view of relevant data, enabling them to quickly identify trends, monitor key metrics, and make informed decisions based on real-time information.
Can the Admin Dashboard be accessed remotely?
Yes, many Admin Dashboards are web-based, allowing administrators to access them remotely from any location with an internet connection.
What technical requirements are needed to implement an Admin Dashboard?
The technical requirements may vary based on the specific dashboard solution chosen. Generally, a web browser and internet connection are essential. Additionally, integration may require compatibility with existing systems.
How can users get support or assistance with the Admin Dashboard?
Users can typically access support through the dashboard provider's help center, documentation, or contact the customer support team for assistance with any issues or questions.


YOU MAY ALSO LIKE


Get in Touch
Got no clue where to start? Why don’t we discuss your idea?

Just pick a time. No forms.


This site uses cookies to improve your user experience. Read our Privacy Policy
Accept